01
The Challenge
A restaurant sales dataset needed to become a clear management view rather than a collection of rows and disconnected totals.

From information to a clear, professional business output.
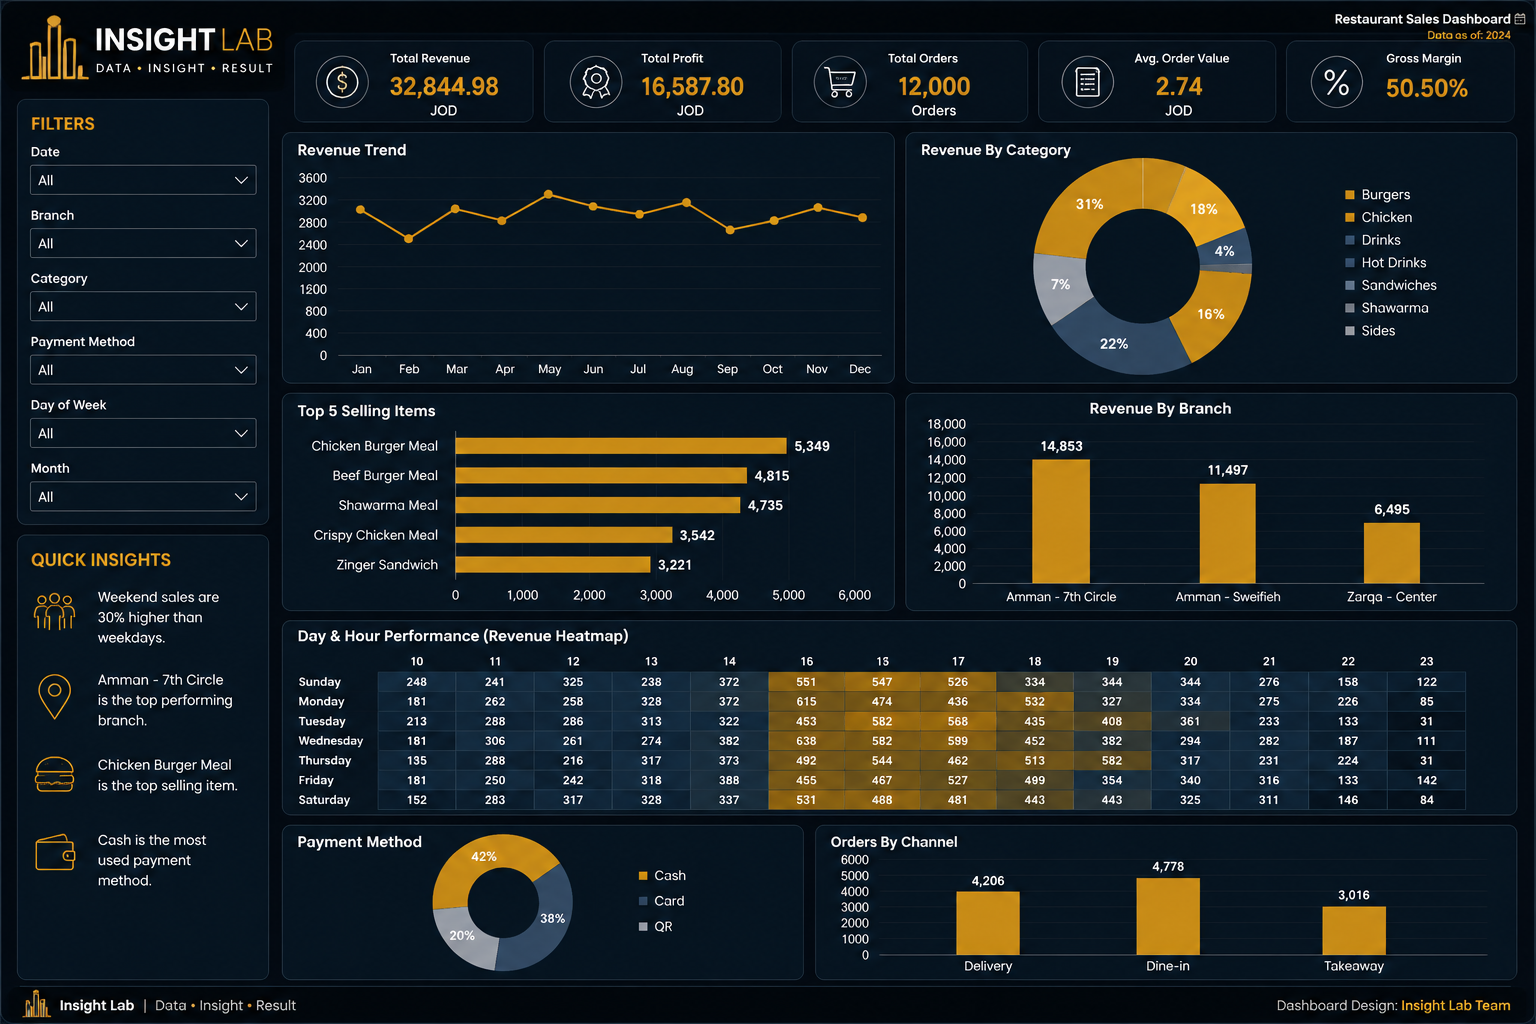
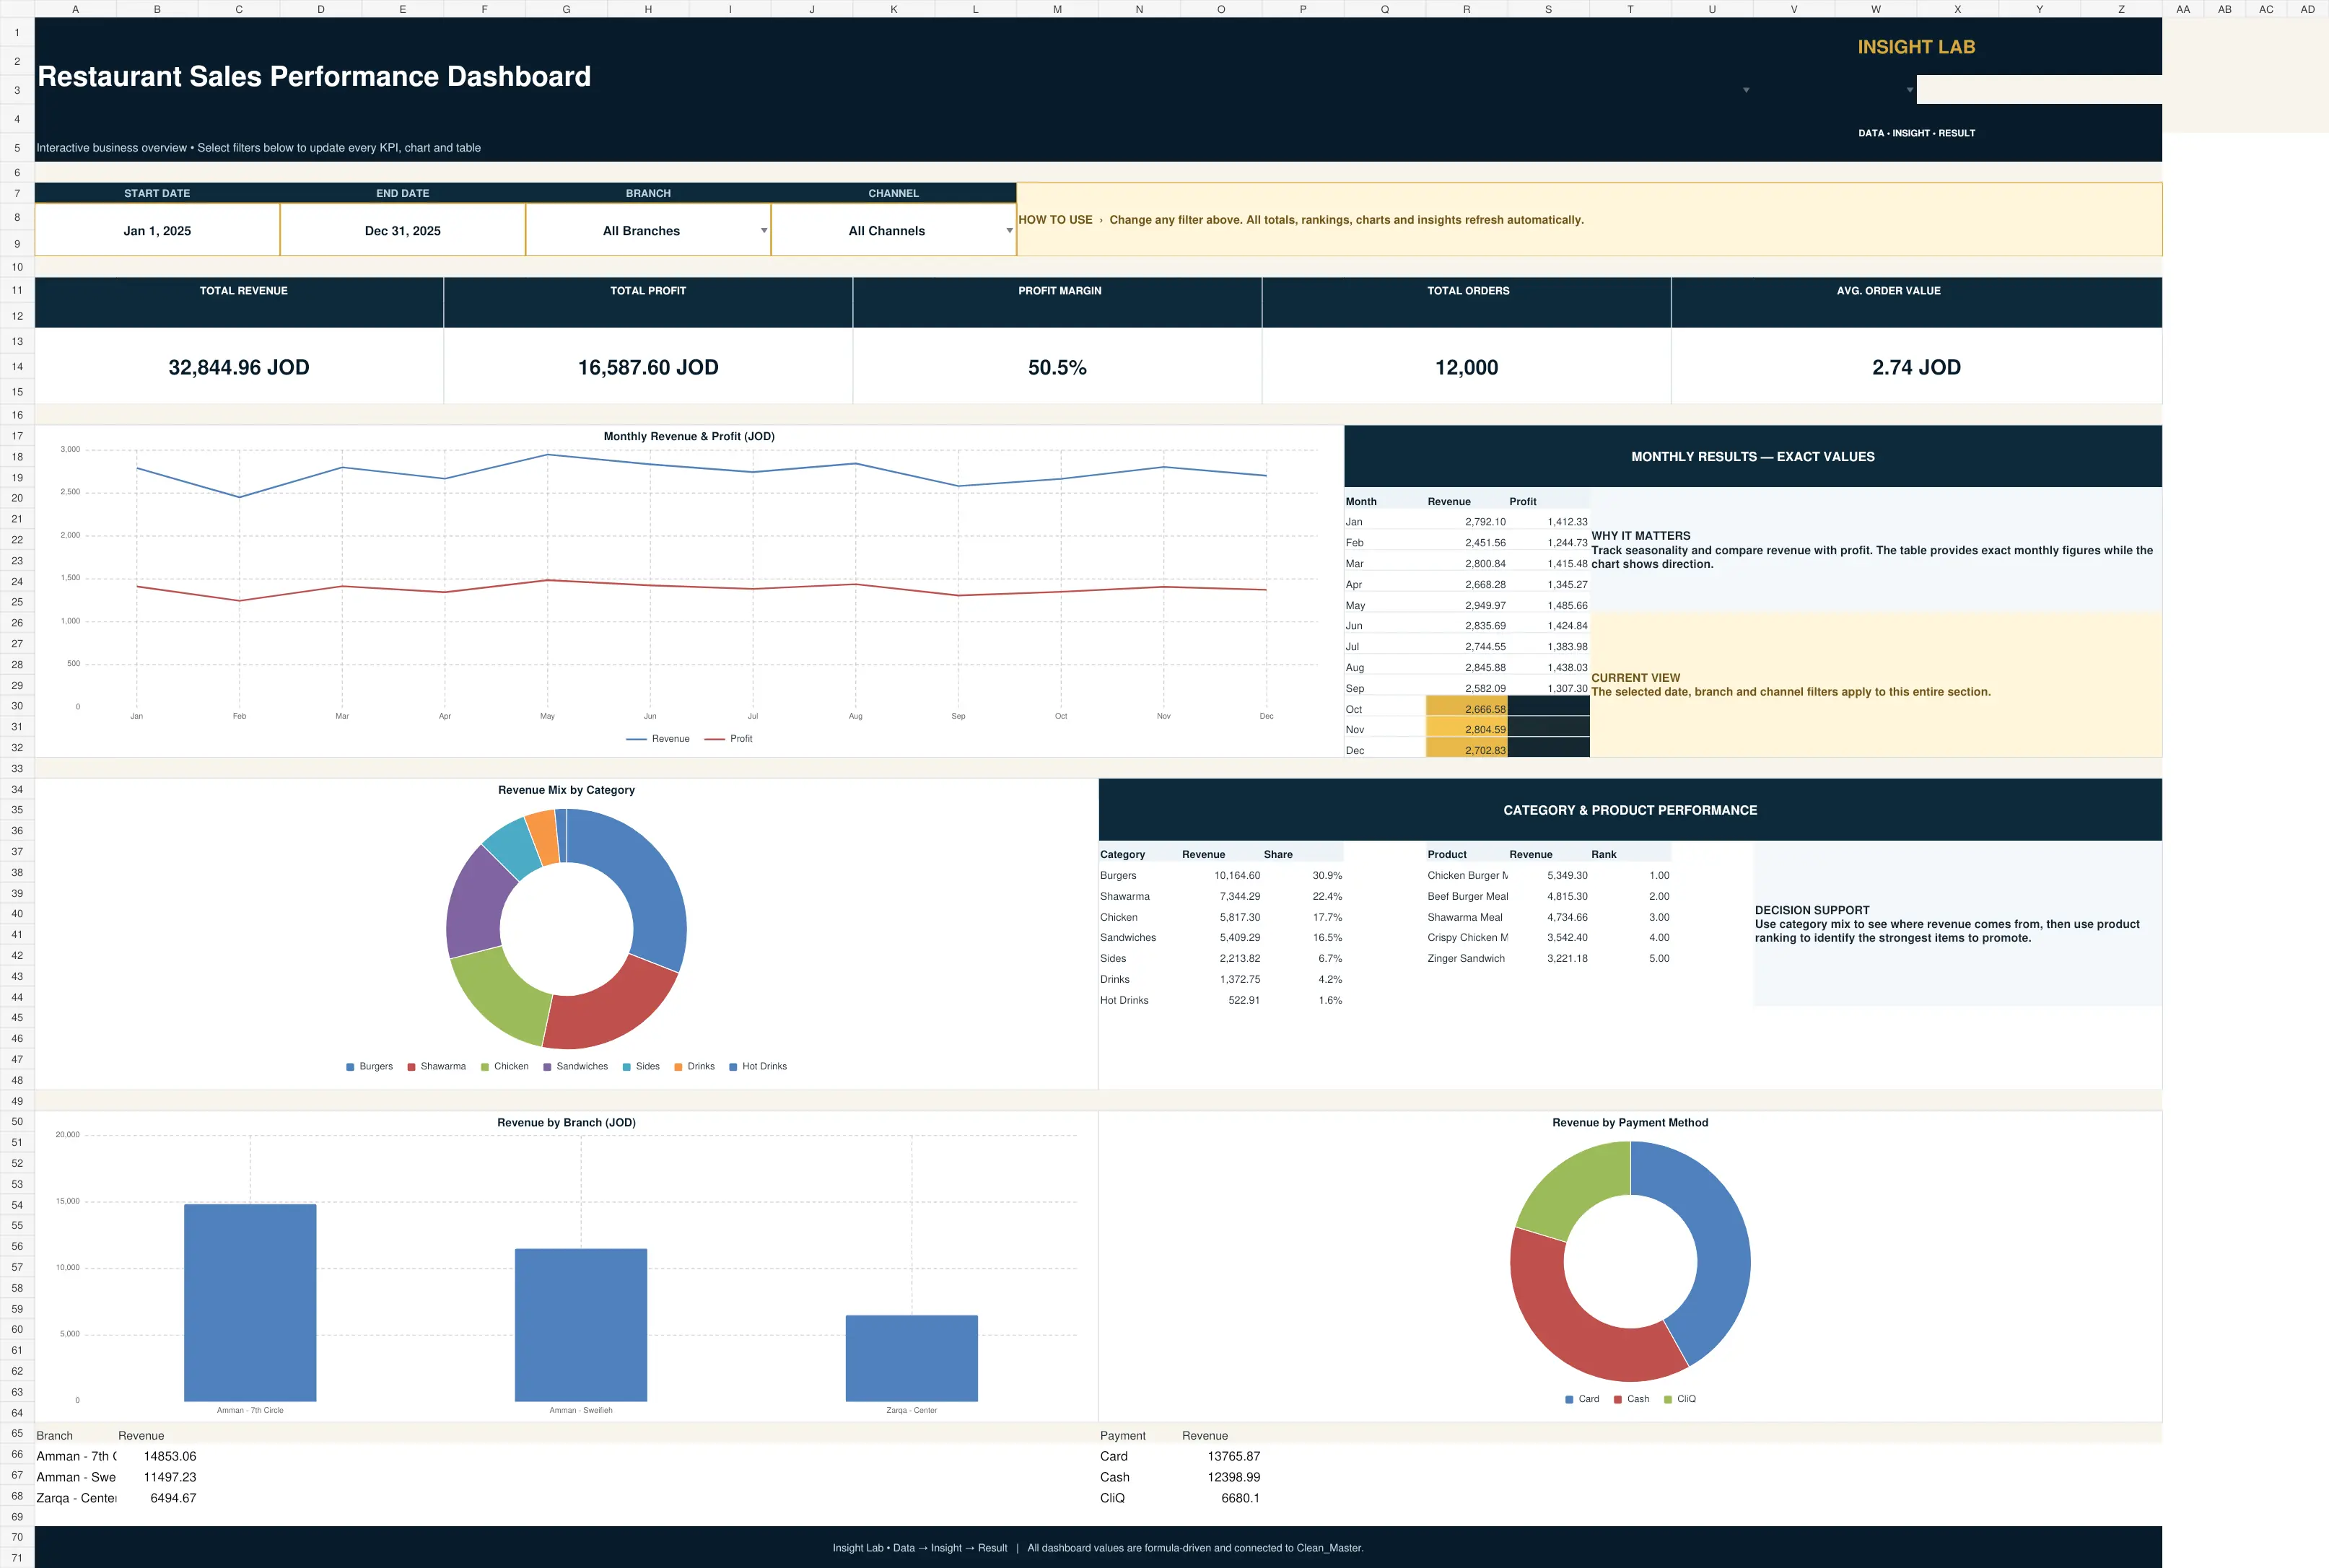
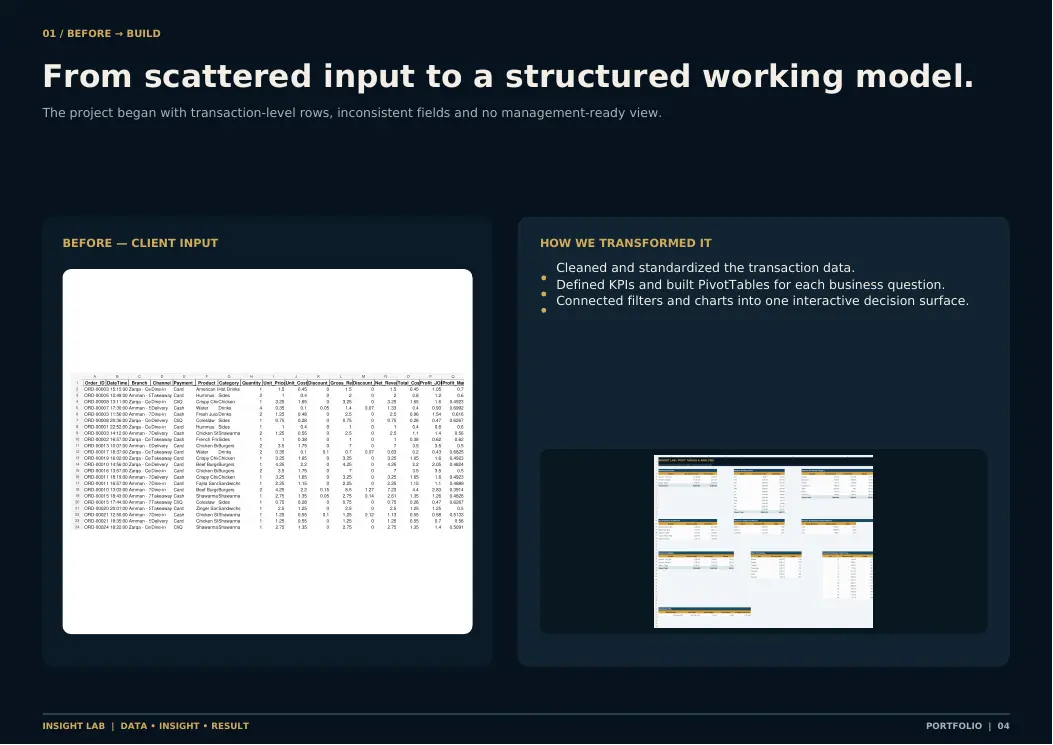
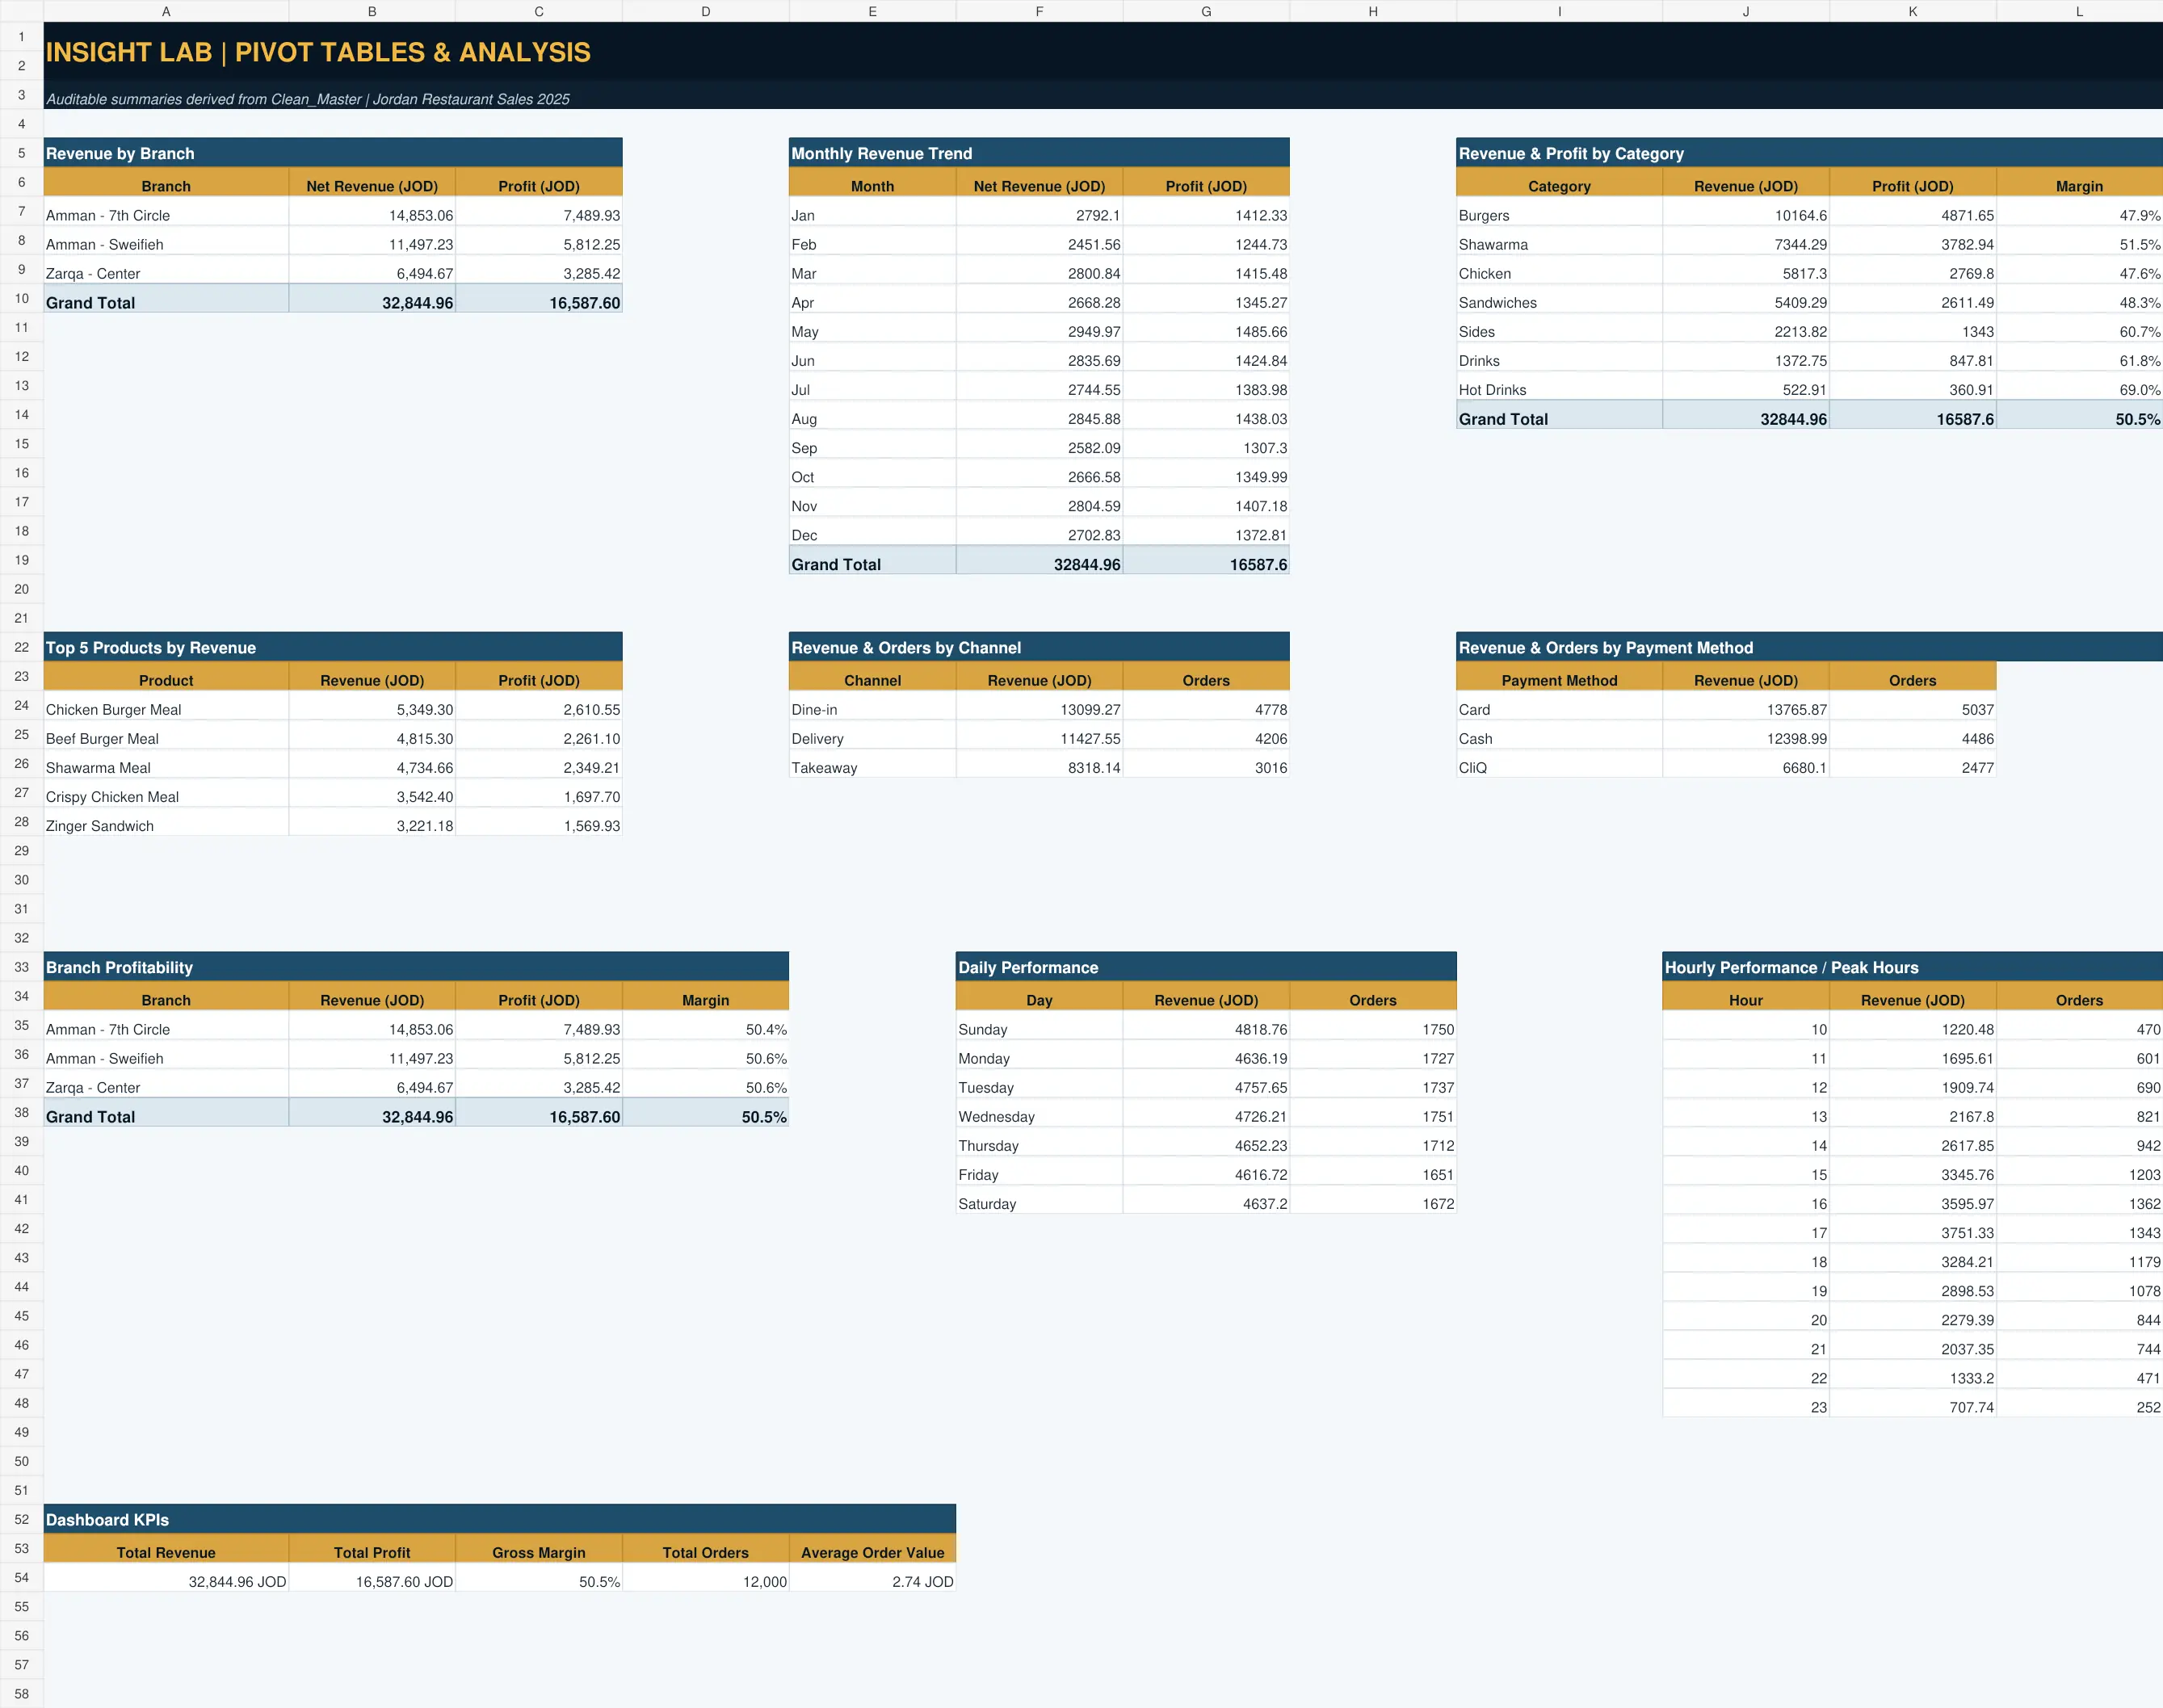
Selected views show the original data, the analytical build and the final decision-ready output.
A restaurant sales dataset needed to become a clear management view rather than a collection of rows and disconnected totals.
Cleaned and structured the data, built PivotTables and PivotCharts, then designed an interactive dashboard with slicers for date, branch, category and payment dimensions.
Clean dataset · Pivot analysis · KPI framework · Interactive Excel dashboard
12,000 orders were summarized into a decision-ready view with approximately JOD 32.8K revenue and a 50.5% gross margin, making branch and category performance immediately visible.