
From business questions
to practical decisions.
Six focused capabilities designed to turn business questions, data and research into clearer decisions and practical action.
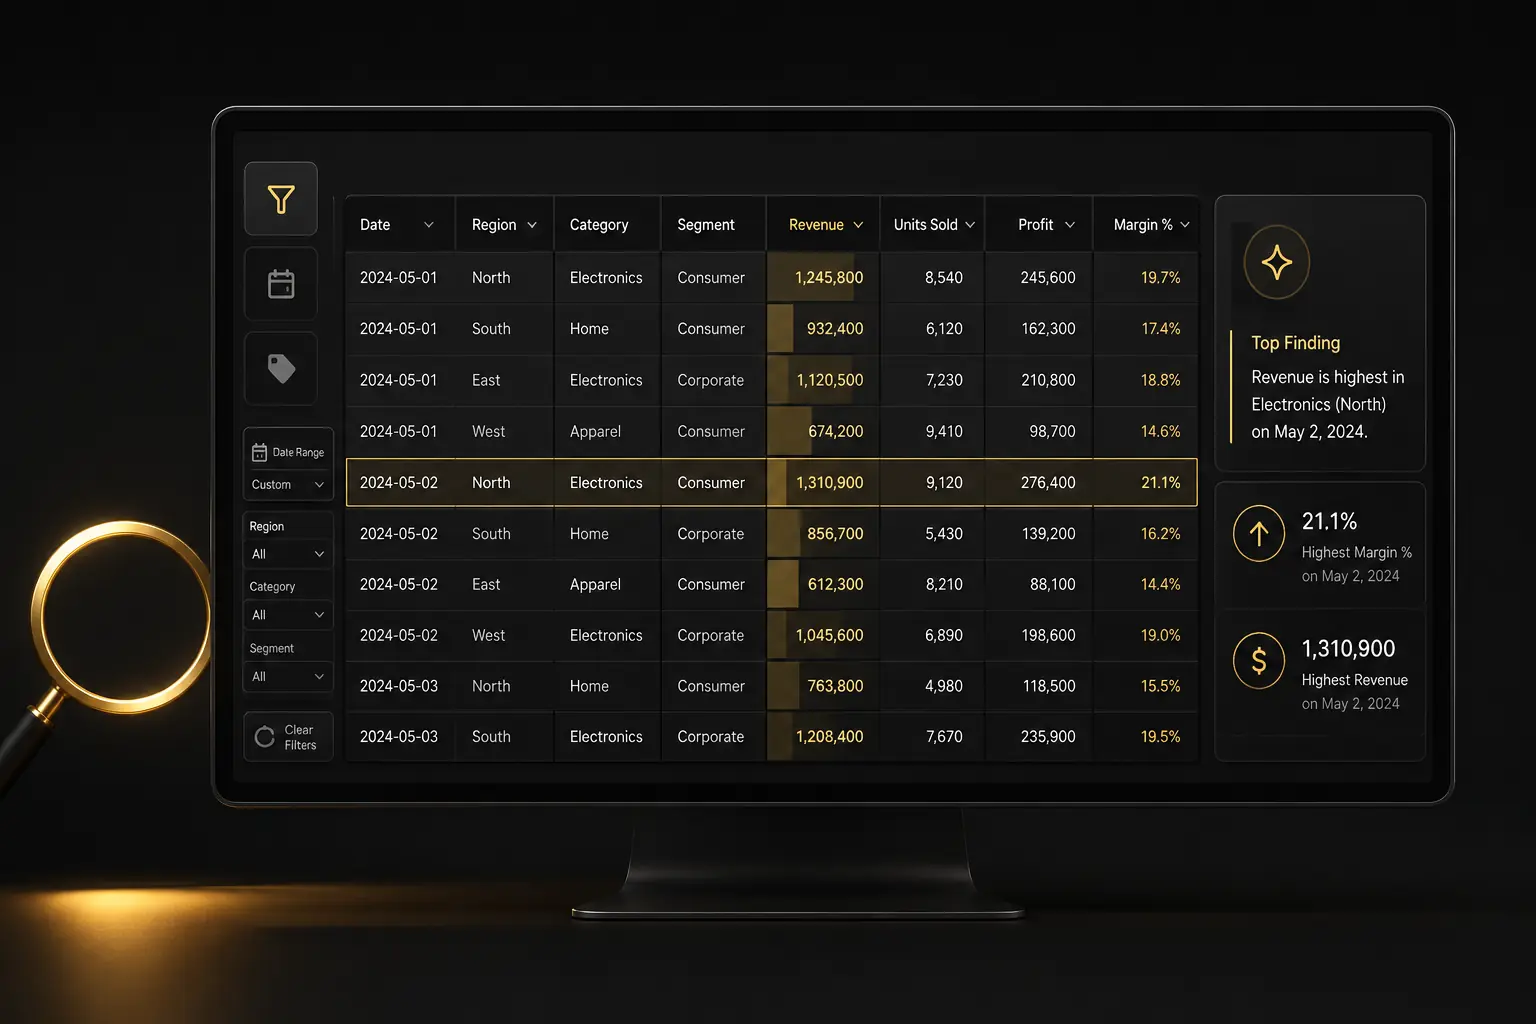
Business & Performance Analysis
Understand what is driving performance, where problems or opportunities exist, and what the evidence suggests should happen next.
Typical output: Performance insights, KPIs, root-cause findings, opportunities and recommendations.
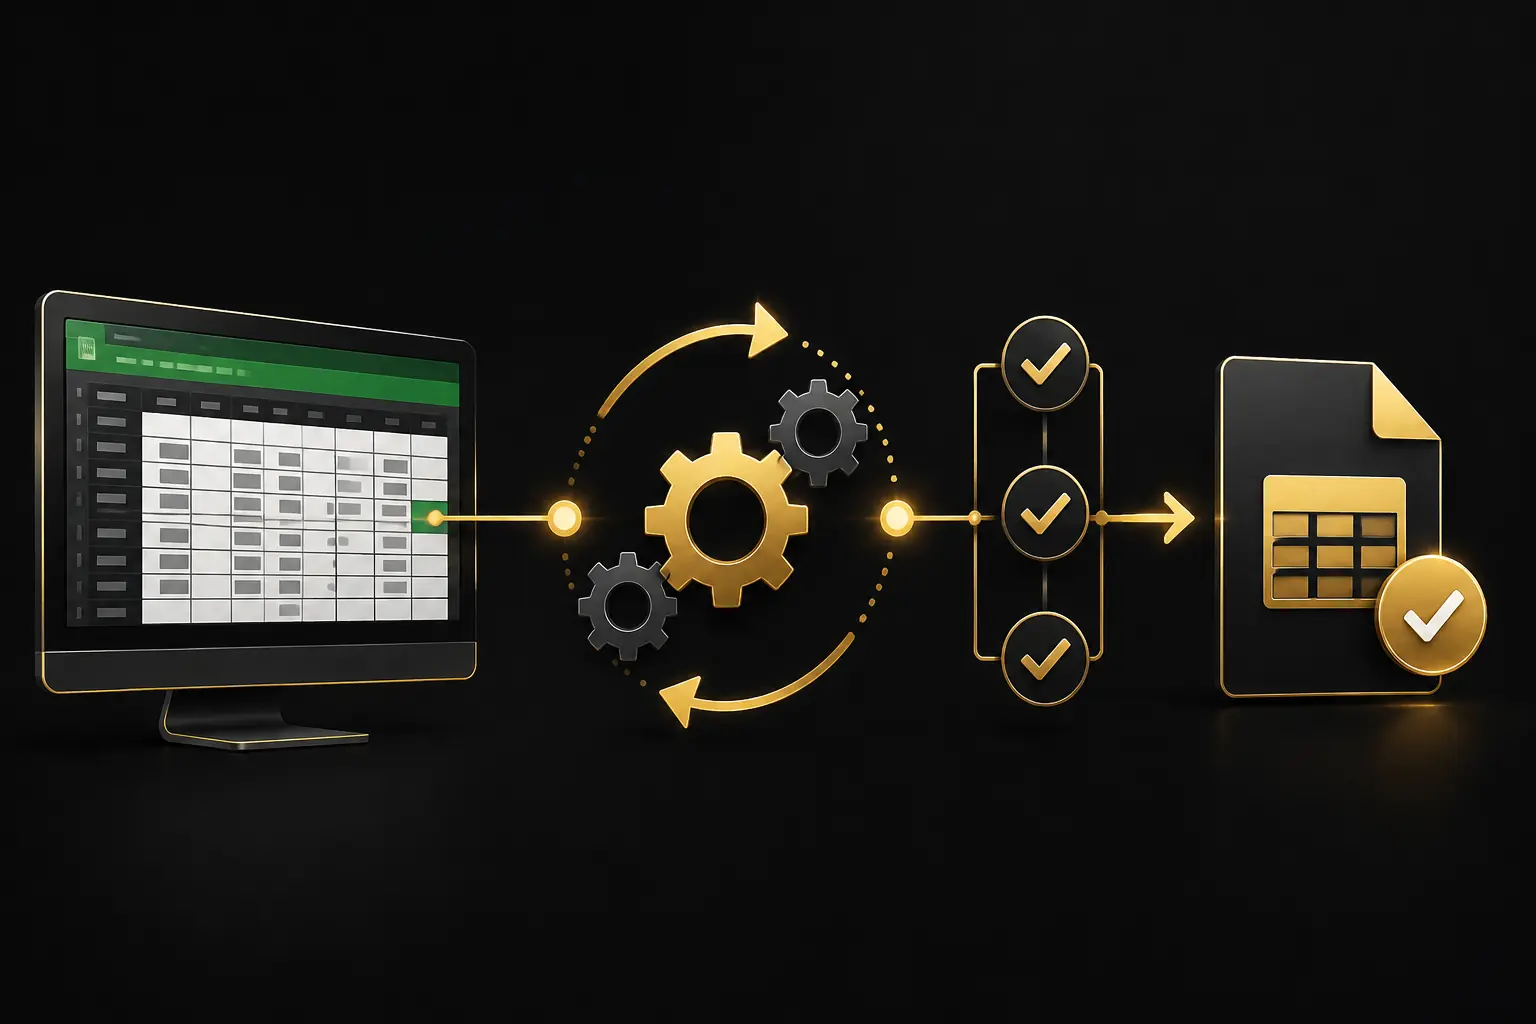
Business Tools & Automation
Build practical tools that reduce manual work, improve visibility and make recurring business tasks easier to manage.
Typical output: Dashboards, automated reports, models, trackers and workflow tools.
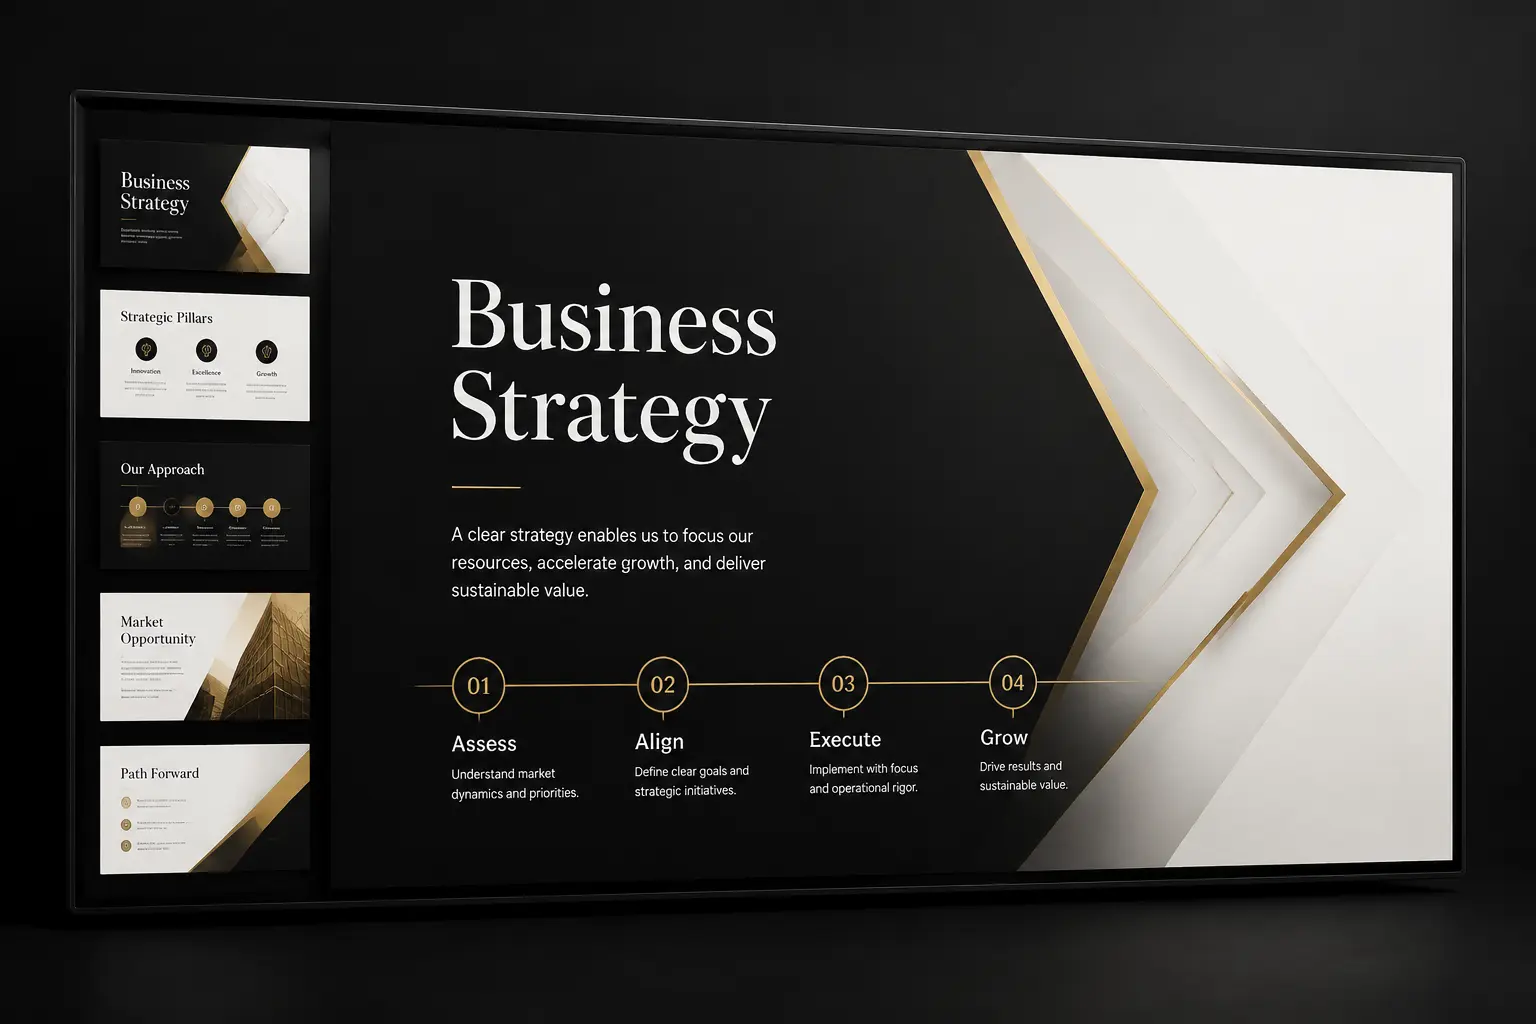
Executive & Decision Presentations
Structure complex business information into a clear executive story built around the decision, recommendation or message that matters.
Typical output: Executive, strategy, decision, pitch and business presentations.
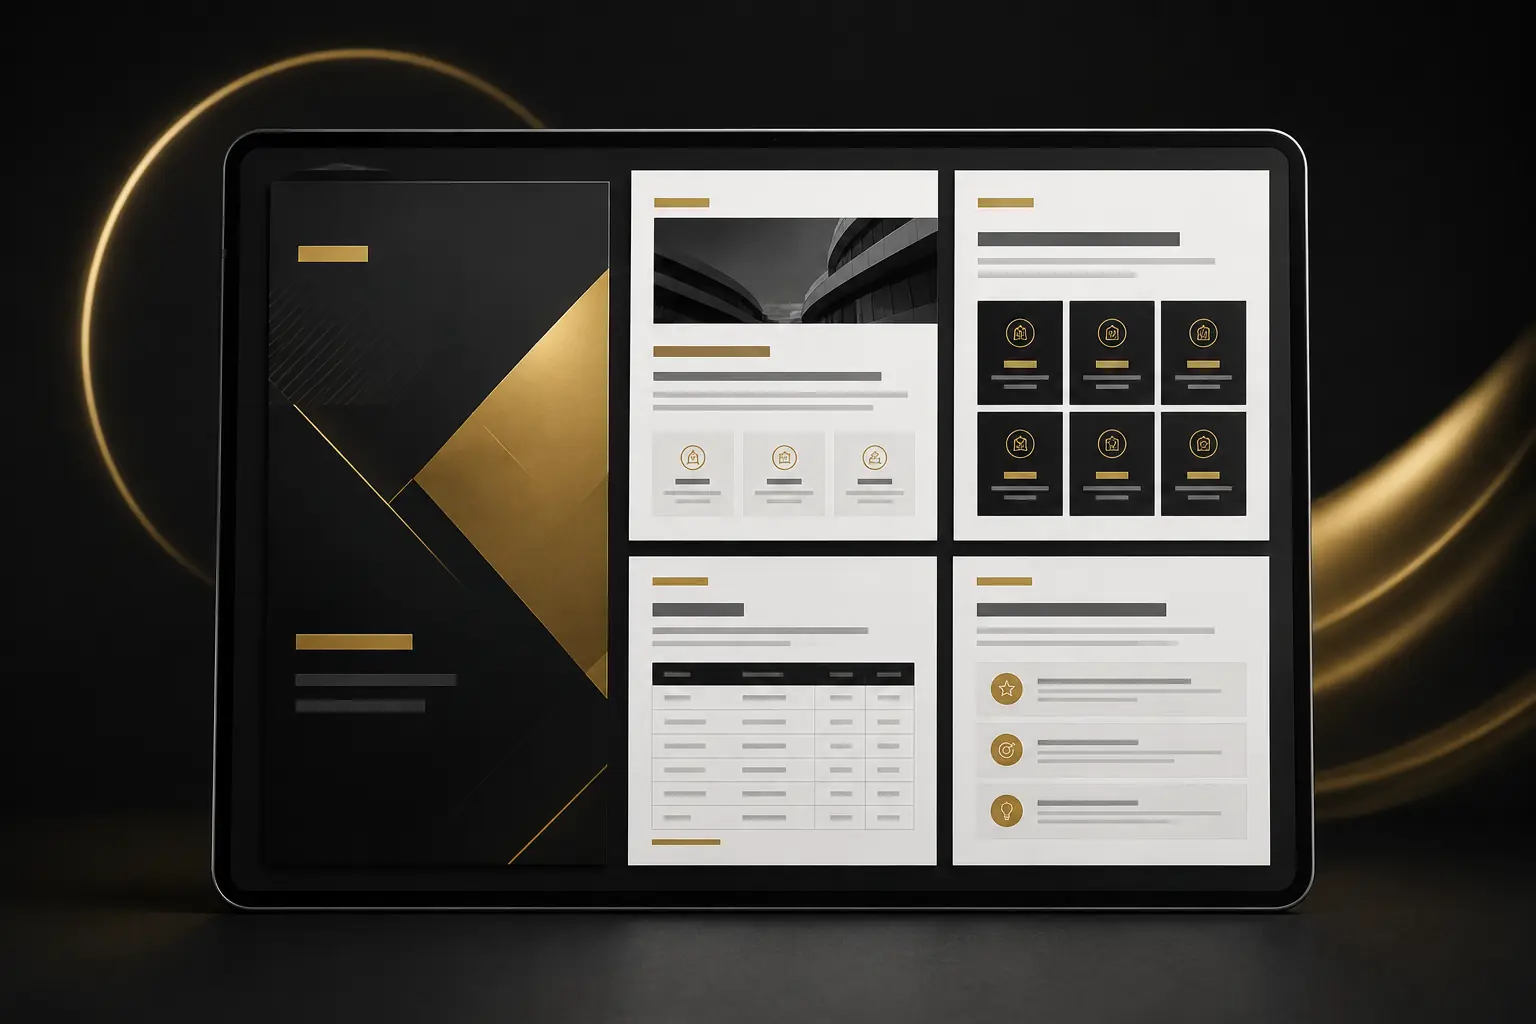
Business Intelligence Reports
Connect data, findings and business context in structured reports that help management understand performance and act on it.
Typical output: Executive summaries, KPI analysis, key findings, recommendations and action plans.
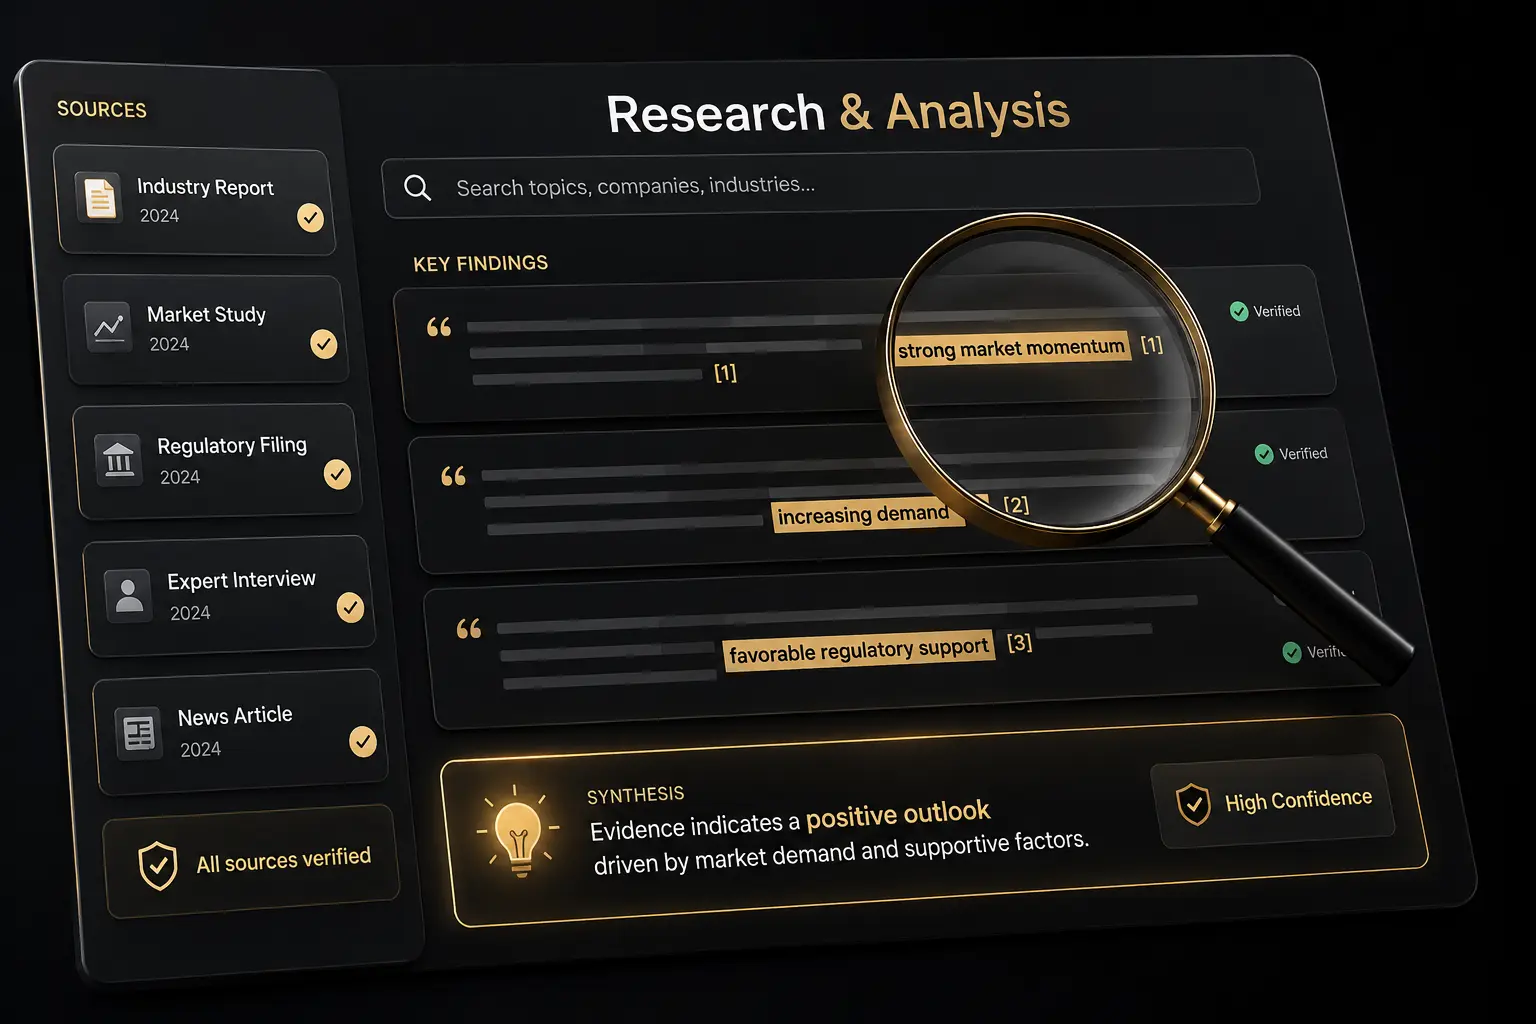
Market & Competitor Intelligence
Evaluate markets, competitors and opportunities around a specific business decision rather than producing research for its own sake.
Typical output: Market assessments, competitor analysis, opportunity evaluation and evidence-based recommendations.
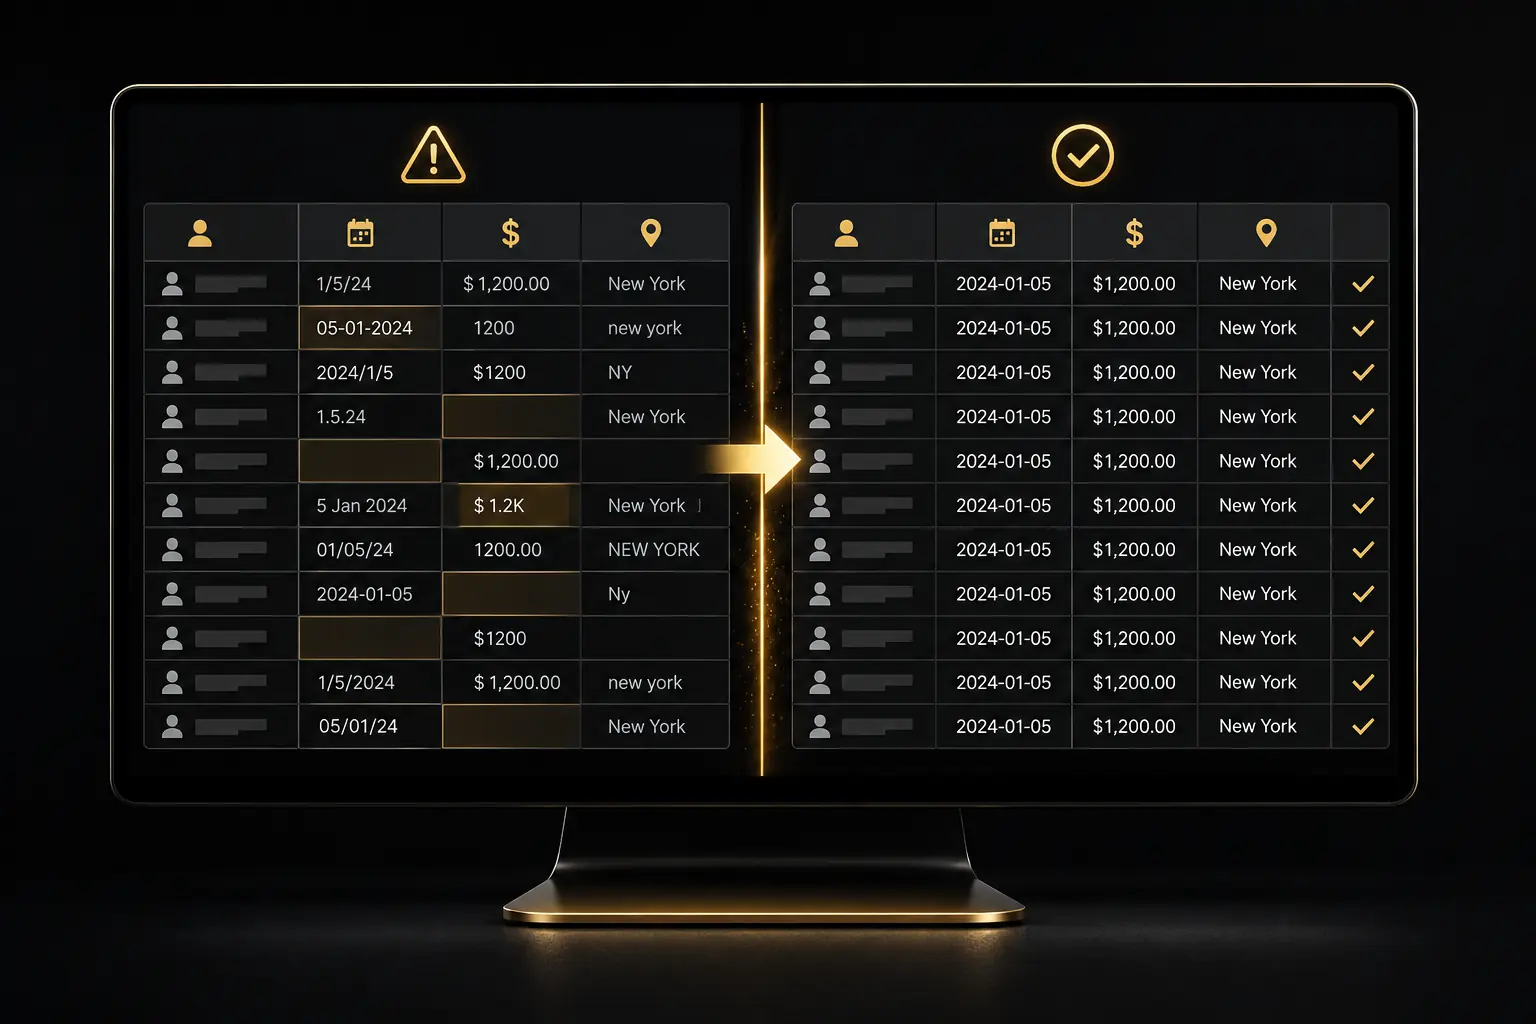
Data Preparation & Quality
Turn inconsistent or messy business data into a reliable foundation for analysis, reporting and decision-making.
Typical output: Clean datasets, standardized fields, quality checks and analysis-ready files.